

In the Schedules menu, booking indicators serve as powerful real-time management tools. Displayed continuously, they allow you to instantly monitor your establishment’s activity level and adjust your service offerings accordingly.
TABLE OF CONTENTS
- View booking statistics
- Interpreting booking indicators
- Dynamic synchronization based on your view
- Hover Tooltip: An Instant Block Summary
- Practical Examples: Using Indicators on a Daily Basis
View booking statistics
To view and analyze your booking metrics, follow the steps below:
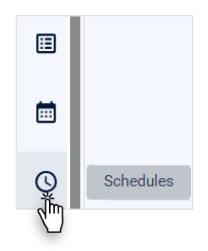
1. Go to the Schedules menu
- Select the Schedules menu in your main navigation bar.

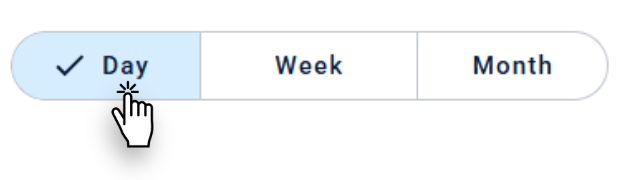
2. Select the desired view
- Select the view that best suits your current analysis needs. Click the Day, Week, or Month button in the top bar of the calendar.
3. Analyze Your Data
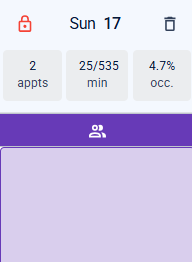
- Check the calendar tiles directly, where your statistics are displayed at all times. Each day provides an instant overview of your activity level. Additionally, depending on the view you select, an overall booking indicator is available for the current week or month.
Interpreting booking indicators
The booking indicators automatically calculate and display three key metrics to give you an accurate overview of your operations.
- The number of appointments (appts)
This indicator tracks the total number of appointments already booked by users for the displayed period.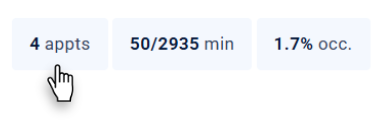
- The number of minutes (min) or appointments (appts)
This data compares the time already booked with the total capacity of your schedule (including the initial time and the remaining time). The unit of measurement automatically adjusts based on the services you display:- The display in minutes (min): If the services selected on the screen have different durations, the system displays the number of minutes occupied by the appointments relative to the total number of scheduled minutes (e.g., 30 min / 200 min).
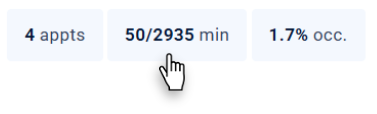
- Display by appointment (appts): If all the services displayed have exactly the same duration, the data is automatically expressed as the number of booked appointments relative to the total number of scheduled appointments (e.g., 3 appts / 10 appts).
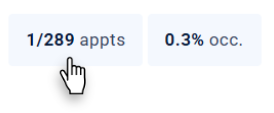
- The display in minutes (min): If the services selected on the screen have different durations, the system displays the number of minutes occupied by the appointments relative to the total number of scheduled minutes (e.g., 30 min / 200 min).
- The occupancy rate (occ.)
Expressed as a percentage, this ratio compares the number of booked appointments to the total number of available minutes. It shows you at a glance whether your staff is underutilized (close to 0%) or operating at full capacity (close to 100%).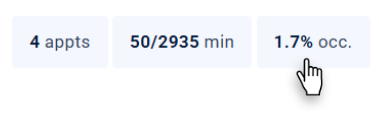
Dynamic synchronization based on your view
To adapt to your management needs, the metrics recalculate their data in real time as soon as you switch views.
- Indicators in Day View
This data allows you to perform precise operational monitoring. You will see only the detailed metrics for the selected day.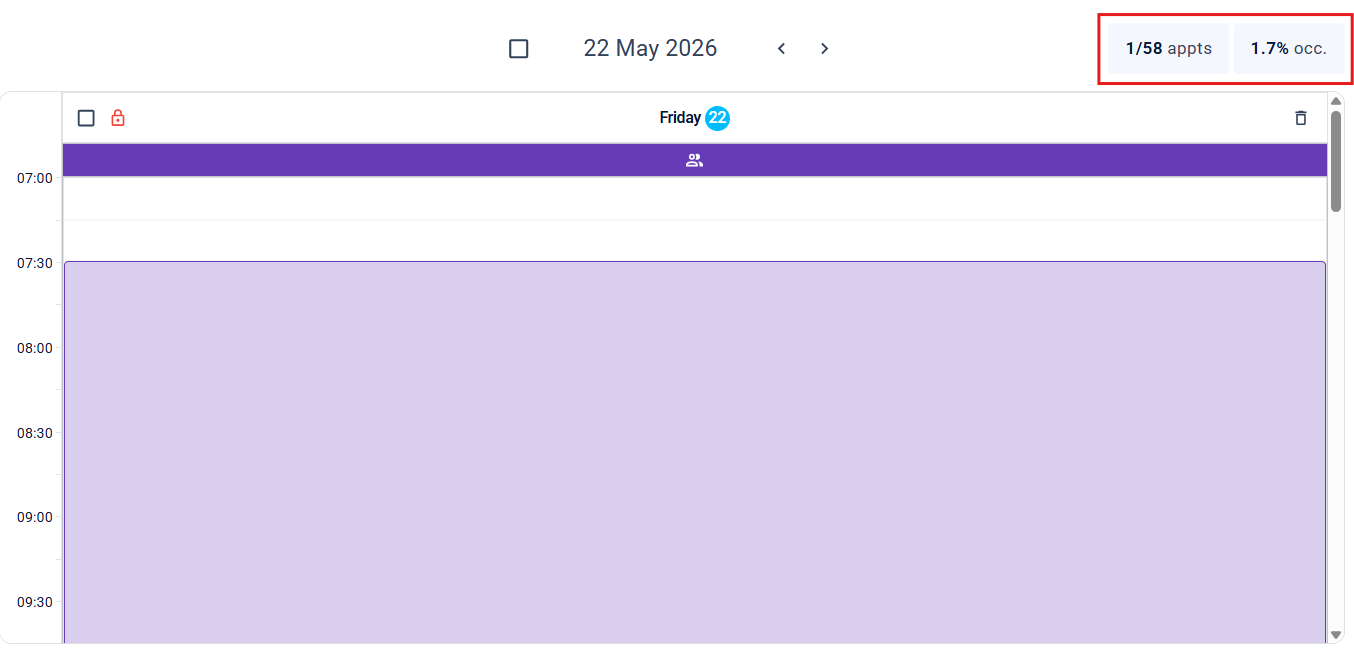
- Indicators in Weekly View
This view is ideal for coordinating your team's short-term activities. The calendar displays an indicator for each day of the week, as well as an overall indicator for the entire week to help you assess the weekly workload.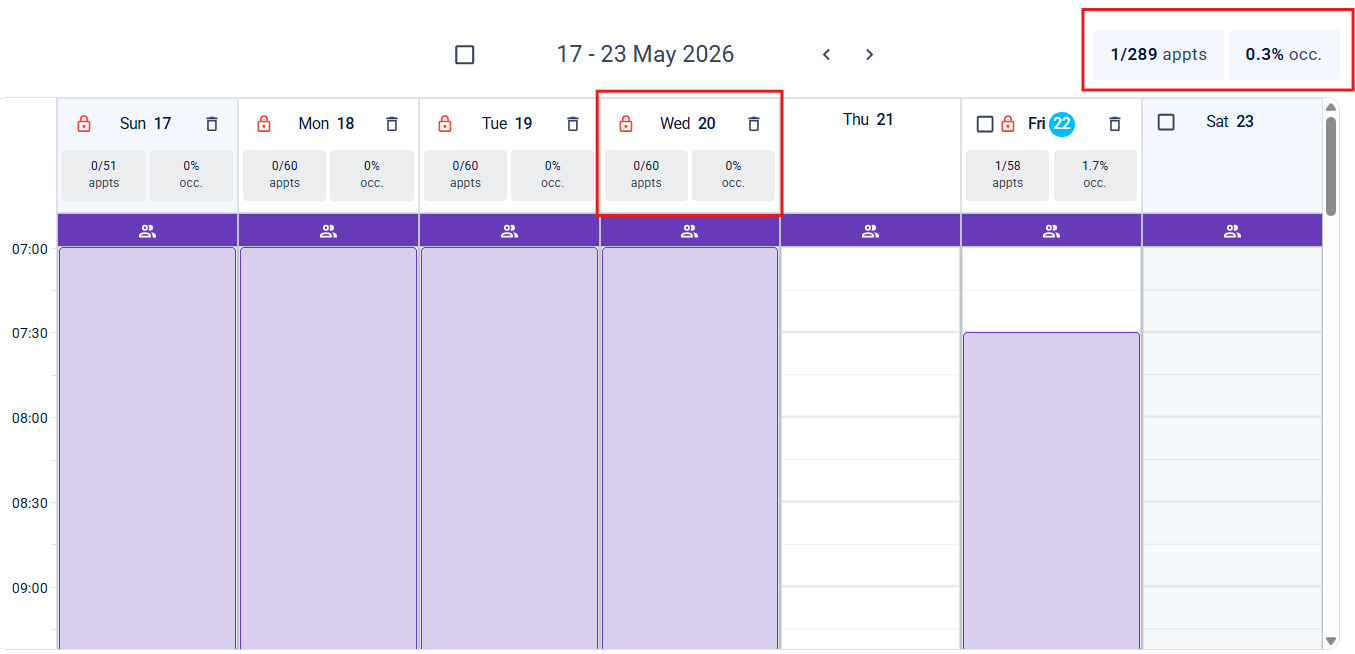
- Indicators in Month View
You'll find a indicator for each day of the month directly in the cells, as well as an indicator for the entire month.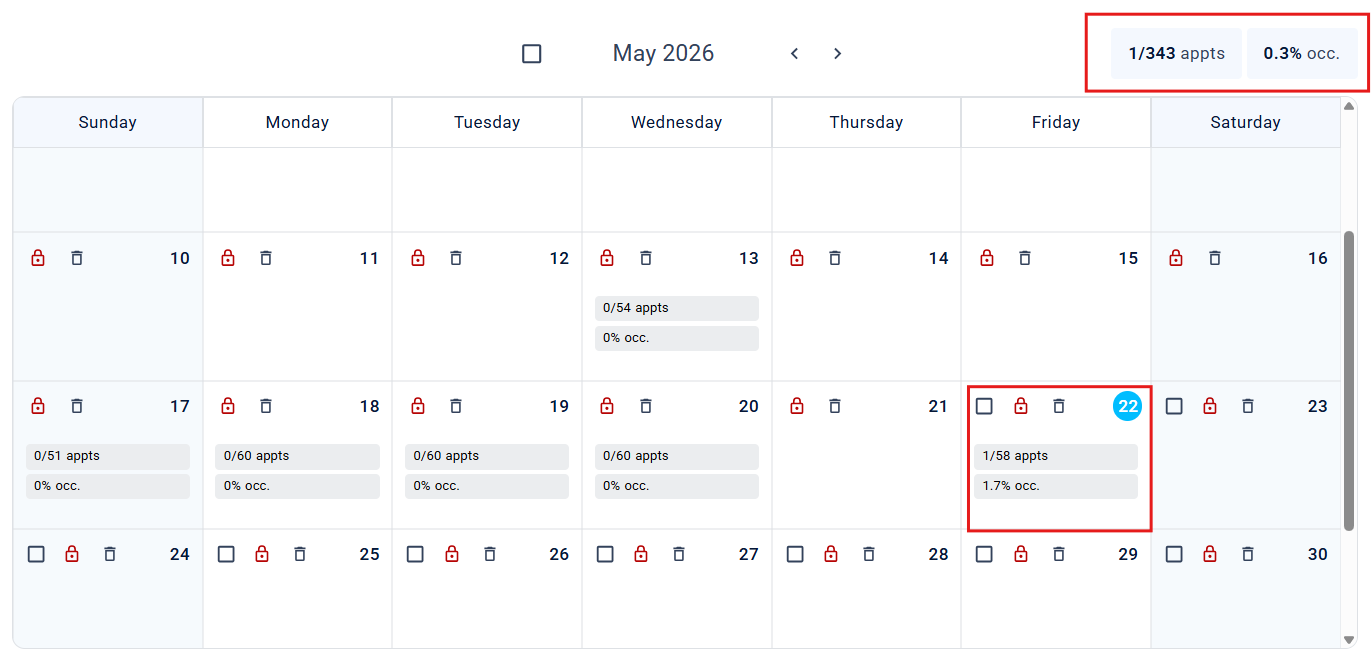
Hover Tooltip: An Instant Block Summary
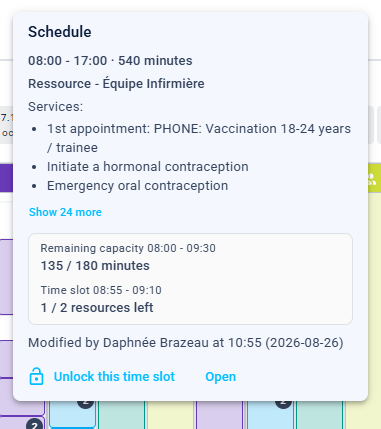
Whether your time block is continuous or split with breaks and staffing/lock variations, the system continuously calculates its remaining capacity in the background.
Hover over the time block
Position your mouse cursor over the targeted time slot in your calendar.- View the contextual tooltip
A tooltip automatically pops up on the screen to show you the exact remaining balance for the slot. - Read the availability metrics
The indicator calculates the remaining capacity:- In appointments: The number of open spots remaining for booking if your services are of equal duration.
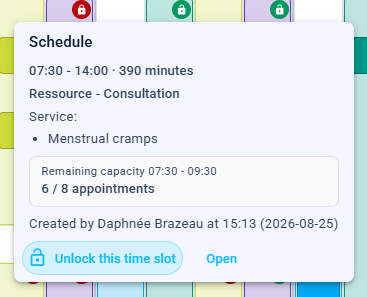
- In minutes: The amount of time still available to fill within the time block if your services vary in duration.
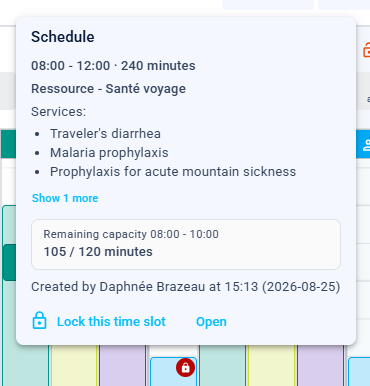
- In available resources: Specifies the number of resources still free within the slot (accessible only in the "Remaining Avails" view).
- In appointments: The number of open spots remaining for booking if your services are of equal duration.
Practical Examples: Using Indicators on a Daily Basis
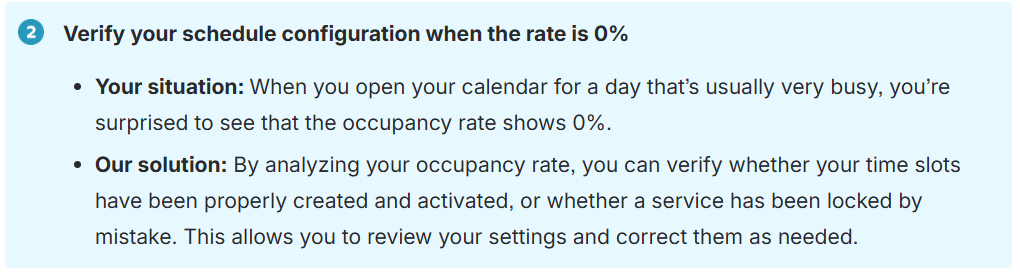
Here are two concrete examples of how these metrics can be useful in your daily work routine.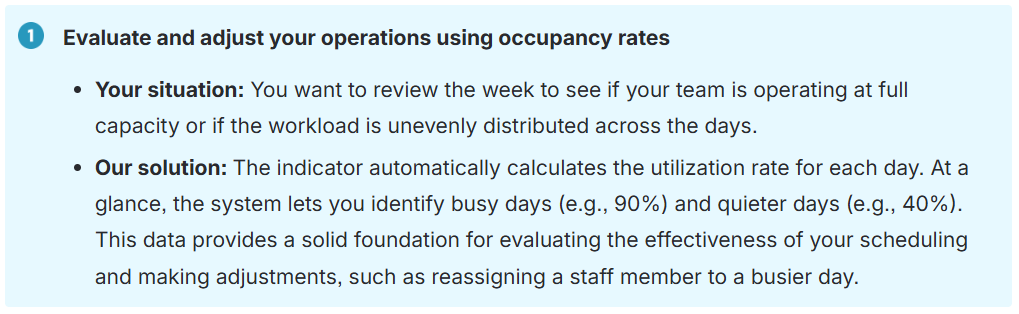
| By phone | Solutions home page | Get help and open a ticket |
| 450-977-2672 poste 2 | Solutions Clic Santé | Open a ticket |

Trimoz Technologies - All rights reserved